
Asian Paints Alchemy 2026
Excel Blog Series
- Introduction to Spreadsheet in Excel
- Features of Spreadsheets in Excel
- Types of Spreadsheets in Excel
- Creating and Managing Spreadsheets in Excel
- Common Uses for Spreadsheets
- Conclusion
- Frequently Asked Questions
- What is a Workbook in Excel?
- Difference between Spreadsheet and Workbook in Excel
- How to Create a Workbook in Excel?
- Managing Excel Workbooks
- Enhancing Navigation and Customization in Excel Workbook
- Ensuring Compatibility and Accessibility of Excel Workbooks
- Advanced Features in For Managing Excel Workbooks
- Conclusion
- Frequently Asked Questions
- Why Go to the Next Line in Excel?
- Method 1: Use Alt + Enter (Windows) or Option + Enter (Mac)
- Method 2: Enable Wrap Text for Automatic Line Breaks
- Method 3: Insert a New Line Using CHAR(10) in Formulas
- Practical Scenarios for Multi-Line Text
- Common Issues and Troubleshooting
- Tips for Managing Multi-Line Text
- Benefits of Multi-Line Text in Excel
- Conclusion
- 1. Inserting a Single Column in Excel Using Right-Click
- 2. Using the Excel Ribbon to Insert Columns
- 3. Adding Multiple Columns in Excel
- 4. Inserting a New Column in an Excel Table
- 5. Keyboard Shortcuts to Insert a Column
- 6. Inserting Blank Columns Across the Entire Worksheet
- Tips for Adding Columns and Rows in Excel
- Conclusion
- Frequently Asked Questions (FAQs)
- How to Delete Blank Rows in Excel?
- Closing Thoughts
- Frequently Asked Questions
- How to Subtract in Excel?
- Points to Remember While Using Subtraction Formula in Excel
- Frequently Asked Questions
- Test Your Skills: Quiz Time
- Basic Multiplication Techniques in Excel
- Multiply Using Formulas and Operators
- Multiply Entire Columns or Rows
- Advanced Multiplication Methods
- Practical Applications
- Troubleshooting and Tips
- Summary
- Frequently Asked Questions
- How To Sum A Column In Excel?
- Advanced Tips for Summing Columns in Excel
- Conclusion
- Frequently Asked Questions
- Division Formula in Excel
- Practical Examples of Division Formula in Excel
- Division Formula in Excel: Troubleshooting Tips
- Frequently Asked Questions
- How To Calculate Percentage in Excel?
- Quick Tips for Working with Percentage in Excel
- How to Calculate Percentage in Excel: Frequently Asked Questions
- Test Your Skills: Quiz Time
- How to Use UNIQUE Formula in Excel: Steps
- How to Find Unique Values in Excel: Advanced Techniques
- Troubleshooting Common Issues
- Practical Applications and Use Cases
- Conclusion
- Frequently Asked Questions
- Understanding the Undo Feature
- How to Undo in Excel?
- Redo Actions in Excel
- Advanced Undo and Redo Techniques
- Limitations and Troubleshooting
- Conclusion
- Frequently Asked Questions
- Introduction to Redo in Excel
- Shortcut Key for Redo
- Redo in Excel: Easy Methods
- Advantages of Using the Redo Feature
- Limitations of the Redo Function
- Conclusion
- Frequently Asked Questions
- What is the TEXTJOIN Function in Excel?
- How to Use the TEXTJOIN Function in Excel
- Benefits of Using TEXTJOIN
- Use Cases for the TEXTJOIN Function
- How to Join Text in Excel Without TEXTJOIN
- Conclusion
- Frequently Asked Questions
- Method 1: Using the Built-In Remove Duplicates Feature
- Method 2: Highlight Duplicates Using Conditional Formatting
- Method 3: Removing Duplicates Using a Formula
- Additional Tips for Removing Duplicates
- Frequently Asked Questions
- Utility of Splitting Cells in Excel
- How to Split Cells in Excel?
- How to Divide a Cell in Excel
- How to Split Columns in Excel
- How to Split Excel Cell into Two Rows
- Frequently Asked Questions
- Purpose of Freezing Rows and Columns in Excel
- How to Fix a Row in Excel?
- How to Freeze Columns in Excel?
- Unfreeze Rows and Columns in Excel
- Additional View Options
- Frequently Asked Questions
- How to Shift Columns in Excel
- Method 1. Drag and Drop to Move Columns
- Method 2. Cut and Paste to Move Columns in Excel
- Method 3. Using the Home Tab to Move Columns
- Method 4. Move Columns with Excel Shortcuts
- Method 5. Reorder Columns with the VBA Macro
- Method 6. Using Paste Options to Transpose Columns to Rows
- FAQs
- How to Apply Strikethrough in Excel?
- Practical Uses and Benefits of Strikethrough in Excel
- Advanced Strikethrough Techniques with Conditional Formatting
- Frequently Asked Questions
- How to Hide & Unhide Columns in Excel
- Closing Thoughts
- Frequently Asked Questions
- How to Lock Cells in Excel?
- Protect Worksheet in Excel
- How to Lock Cells in Excel: Tips for Cell Security
- Closing Thoughts
- Frequently Asked Questions
- How to Remove Scroll Lock in Excel on Windows?
- How to Remove Scroll Lock in Excel on Mac?
- How to disable scroll lock in Excel: Troubleshooting Tips
- Frequently Asked Questions
- How to Add a Row in Excel
- How to Delete a Row in Excel
- Conclusion
- Frequently Asked Questions
- Introduction to Excel Formulas and Functions
- What is a Formula in Excel?
- What is a Function in Excel?
- What is the Difference between Formulas and Functions?
- When to Use Formulas vs. Functions
- Examples of Functions and Formulas
- Conclusion
- Frequently Asked Questions
- Understanding How to Transpose in Excel
- Methods to Transpose Data in Excel
- Conclusion
- Frequently Asked Questions
- Understanding DATEDIF Function in Excel
- Using DATEDIF Formula in Excel
- Practical Examples of DATEID Functions in Excel
- Benefits of DATEDIF Formula in Excel
- Addressing Common Issues with DATEDIF Function in Excel
- Closing Thoughts
- Frequently Asked Questions
- What is SUMIF Function in Excel?
- SUMIF Function in Excel Examples
- Best Practices for SUMIF Usage
- Frequently Asked Questions
- How to Calculate Age in Excel?
- Summing Up
- Ageing Formula In Excel: Frequently Asked Questions
- How to Insert PDF in Excel? Step-by-Step Process
- Formatting Options of PDF Files in Excel
- Benefits of PDF in Excel
- How to Insert a PDF File in Excel: Common Issues and Solutions
- Closing Thoughts
- Frequently Asked Questions
- What is HLOOKUP in Excel?
- HLOOKUP Formula in Excel with Example
- Common Issues with HLOOKUP Formula in Excel
- HLOOKUP vs. VLOOKUP
- Conclusion
- Frequently Asked Questions
- What is PMT Formula in Excel?
- PMT Formula Syntax
- How to Use the Excel PMT Formula
- Example: Calculating a Monthly Loan Payment
- Breaking Down PMT Formula Results
- Advanced Use: Customize Payment Frequency and Start Point
- FAQs
- What is the TODAY Function in Excel?
- How to Use the TODAY Formula in Excel
- Combining the TODAY Formula with Other Functions
- Practical Use Cases for the TODAY Function
- Limitations of the TODAY Function
- Frequently Asked Questions
- Conclusion
- Why Copying Formulas is Important?
- Methods to Copy Formulas in Excel
- Maintaining Formula Accuracy When Copying
- Common Scenarios for Copying Formulas
- Tips for Copying Formulas Effectively
- Conclusion
- Frequently Asked Questions (FAQs)
- Test Your Skills: Quiz Time
- What is the WEEKDAY Function?
- Using WEEKDAY Formula in Excel with Other Functions
- Filtering Workdays and Weekends
- Best Practices for WEEKDAY Formula in Excel
- Conclusion
- Frequently Asked Questions
- What is the XIRR Formula in Excel?
- XIRR Formula Syntax
- How to Calculate XIRR in Excel
- Common Errors with XIRR Formula and How to Fix Them
- Using an XIRR Calculator in Excel
- Advantages of Using XIRR in Excel
- Applications of XIRR in Excel
- Conclusion
- Frequently Asked Questions (FAQs)
- Purpose of the COUNTA Function in Excel
- Syntax of COUNTA Formula in Excel
- When to Use COUNTA
- Practical Examples of COUNTA Formula in Excel
- Tips for Effective Use of COUNTA
- Conclusion
- Frequently Asked Questions
- What is Goods and Services Tax?
- Excel for GST Calculation
- How to Calculate GST Using Excel?
- Key Features of GST
- Benefits of Calculating GST in Excel
- Additional Tips for Using Excel for GST Calculations
- Frequently Asked Questions
- Understanding the MAX Formula in Excel
- Using MAX Formula in Excel with Ranges
- Tips for Effective Use of MAX Formula in Excel
- Conclusion
- Frequently Asked Questions
- Grade Formula in Excel
- Using IF Function for Grades
- Mark Sheet Grade Formula in Excel
- Implementing Nested IF and IFS Functions
- Applying VLOOKUP for Grade Calculation
- Best Practices and Tips
- Conclusion
- Frequently Asked Questions (FAQs)
- Test Your Skills: Quiz Time
- How to Remove Filters in Excel
- Tips for Managing Filters in Excel
- Conclusion
- Frequently Asked Questions
- How to Remove Formula in Excel?
- Tips for Managing Formulas in Excel
- Conclusion
- Frequently Asked Questions
- Basic Navigation Shortcuts
- Data Selection Shortcuts
- Copy, Paste, and Formatting Shortcuts
- Formula Shortcuts
- Workbook and Worksheet Management Shortcuts
- Cell Formatting Shortcuts
- Ribbon and Menu Shortcuts
- Macros and Custom Shortcuts
- Shortcuts for Windows
- Function Shortcuts
- Chart Shortcuts
- Filtering and Sorting Shortcuts
- Shortcut keys for Pivot Tables
- Frequently Asked Questions
- Why Compare Columns in Excel?
- Methods to Compare Columns
- 1. Using the EXACT Function for Direct Comparison
- 2. Using Conditional Formatting for Visual Comparison
- 3. Using the IF Function for Custom Messages
- 4. Comparing Columns Across Different Spreadsheets Using VLOOKUP
- 5. Highlighting Duplicate or Unique Values in a Single Column
- 6. Using INDEX and MATCH Functions for Advanced Comparisons
- Additional Tips
- Examples
- Frequently Asked Questions
- How to Search in Excel: Basic Search Options
- Conclusion
- Frequently Asked Questions
- How to Remove a Drop-Down List in Excel
- Conclusion
- Understanding the Issue: Arrow Keys Not Working in Excel
- Common Causes of Arrow Key Problems in Excel
- Troubleshooting Steps to Fix Arrow Key Issues in Excel
- Advanced Solutions for Persistent Arrow Key Issues
- Conclusion
- Frequently Asked Questions
- 6 Ways to Add Leading Zeroes in Excel
- Removing Leading Zeros
- Additional Tips and Tricks
- Conclusion
- Frequently Asked Questions
- What Does the #### Error Mean in Excel?
- Types of Error in Excel
- Common Causes of the #### Error in Excel
- How to Fix the #### Error in Excel?
- Additional Tips for Preventing the #### Error
- Conclusion
- Frequently Asked Questions
- How to Add Degree Symbol in Excel
- Conclusion
- Frequently Asked Questions
- Methods for Adding Bullets in Excel
- Tips for Better Bullet Management
- Conclusion
- Frequently Asked Questions
- Insert Picture in Excel
- Manage Picture Placement
- Insert Multiple Pictures
- How to Insert a Picture into a Cell in Excel: Effective Use of Images
- Frequently Asked Questions
- How to Make First Letter Capital in Excel: Key Methods
- Conclusion
- Frequently Asked Questions
- What is Alignment in Excel?
- Types of Alignment in Excel
- How to Align Text in Excel?
- Purpose of Alignment in Excel
- Conclusion
- Frequently Asked Questions
- Understanding Excel Dashboards
- How to Make a Dashboard in Excel?
- Key Features of Excel for Dashboards
- Common Challenges with Excel Dashboards
- Designing Effective Dashboards: Tips
- Conclusion
- Frequently Asked Questions
- Methods for Inserting the Diameter Symbol
- Additional Tips and Alternatives
- Conclusion
- Frequently Asked Questions
- Understanding Headers and Footers
- How to Set Header in Excel?
- How to Put Footer in Excel?
- Editing and Formatting Headers and Footers
- Printing with Headers and Footers
- How to Remove Header and Footer in Excel?
- Conclusion
- Frequently Asked Questions
- Understanding Hyperlinks in Excel
- Creating Links in Excel
- Advanced Linking Techniques
- Managing Links in Excel
- Frequently Asked Questions
- Understanding Hyperlinks in Excel
- How to Remove Hyperlink in Excel: 3 Easy Ways
- Disabling Automatic Hyperlink Creation
- Common Issues and Solutions
- Conclusion
- Frequently Asked Questions
- Definition of an MIS Report in Excel
- Importance of MIS Reports
- Types of MIS Reports in Excel
- Steps to Create an MIS Report in Excel
- Differences Between MIS Reports and Spreadsheets
- Advantages of Using Excel for MIS Reports
- Conclusion
- Frequently Asked Questions
- How to Calculate Time in Excel?
- Time Difference Formula in Excel: Basic Steps
- Advanced Time Difference Calculations
- Handling Negative Time Values and Date Systems
- Formatting and Displaying Time Differences
- Additional Time Calculations
- Practical Applications
- Conclusion
- Frequently Asked Questions
- Understanding Blank Cells in Excel
- How to Fill Empty Cells in Excel?
- Advantages of Different Techniques
- Challenges with Filling Blank Cells
- Conclusion
- Frequently Asked Questions
- Test Your Skills: Quiz Time
- Why Add Commas in Excel?
- Methods to Add Commas in Excel
- Conclusion
- Frequently Asked Questions
- What are Gridlines in Excel?
- Customizing Excel Gridlines
- How to Remove Cell Lines in Excel?
- Changing the Color of Gridlines
- Printing Excel Gridlines
- Quick Tricks and Shortcuts
- Tailoring Gridlines in Excel: Useful Tips
- Conclusion
- Frequently Asked Questions
- What Is Standard Deviation?
- How to Find Standard Deviation in Excel?
- How to Calculate Standard Deviation in Excel?
- Benefits of Using Standard Deviation
- Standard Deviation vs. Standard Error
- Conclusion
- Frequently Asked Questions
- Understanding the Basics of the AVERAGE Formula
- How to Calculate AVERAGE in Excel?
- Variations of the AVERAGE Function
- Common Errors and How to Avoid Them
- Practical Applications of AVERAGE in Excel
- Conclusion
- What is an Excel Table?
- How to Create a Table in Excel?
- How to Convert Data into a Table in Excel?
- How to Make a Graph in Excel from a Table?
- Exploring Excel Table Features
- Advantages of Using Tables in Excel
- Customizing and Advanced Features
- Common Issues and Solutions in Excel Table
- Practical Applications of Tables
- Conclusion
- Why Use Statistical Functions in Excel?
- Top Statistical Functions in Excel with Examples
- Advanced Statistical Function in MS Excel
- Key Benefits of Mathematical and Statistical Functions in Excel
- Applications of Statistical Functions in Excel
- Conclusion
- Frequently Asked Questions
- Why Use Borders in Excel?
- How to Add Borders in Excel: Step-by-Step Guide
- How to Remove Borders in Excel
- How to Insert Border in Excel Automatically
- Conclusion
- Frequently Asked Questions (FAQs)
- Why Remove or Reduce Decimals in Excel?
- How to Remove Decimal Points in Excel
- How to Reduce Decimals in Excel
- Conclusion
- Frequently Asked Questions (FAQs)
- What is an Area Chart in Excel?
- Types of Area Charts in Excel
- How to Create an Area Chart in Excel
- Customizing the Plot Area in Excel
- Applications of Area Charts
- Advantages and Limitations of Area Charts
- Conclusion
- Frequently Asked Questions (FAQs)
- Why Alphabetical Sorting is Essential
- How to Arrange in Alphabetical Order in Excel
- Quick Tips for Alphabetical Sorting
- Conclusion
- Frequently Asked Questions
- Test Your Skills: Quiz Time
- Why Count Colored Cells?
- Methods to Count Colored Cells in Excel
- Conclusion
- Frequently Asked Questions
- Introduction to Watermarks in Excel
- How to Add a Watermark in Excel
- How to Remove a Watermark in Excel
- Customizing Watermarks in Excel
- Practical Applications of Watermarks in Excel
- Tips for Using Watermarks in Excel
- Conclusion
- Frequently Asked Questions (FAQs)
- What is the IFERROR Formula in Excel?
- How to Use the IFERROR Formula in Excel
- Practical Applications of the IFERROR Formula
- Advanced Uses of the IFERROR Formula
- Key Benefits of Using the IFERROR Formula
- Limitations of the IFERROR Formula
- Conclusion
- Frequently Asked Questions
- What Is Data Validation in Excel?
- Why Use Data Validation in Excel?
- How to Add Data Validation in Excel
- How to Use Data Validation in Excel: Practical Examples
- Custom Data Validation in Excel: Examples
- Data Validation in Excel Shortcut
- Benefits of Data Validation in Excel
- Limitations of Data Validation
- Conclusion
- Frequently Asked Questions
- What is the SUMPRODUCT Formula in Excel?
- How to Use the SUMPRODUCT Formula in Excel
- Advanced Uses of SUMPRODUCT
- Benefits of Using SUMPRODUCT in Excel
- Limitations of SUMPRODUCT
- Tips for Effective Use of SUMPRODUCT
- Conclusion
- Frequently Asked Questions (FAQs)
- What is the FIND Formula in Excel?
- How to Use the FIND Formula in Excel
- Advanced Applications of the FIND Function
- Limitations of the FIND Formula
- Alternatives to FIND in Excel
- Tips for Using the FIND Function
- Conclusion
- Frequently Asked Questions (FAQs)
- What is an Excel Slicer?
- Why Use Slicers in Excel?
- How to Add Slicers in Excel
- How to Use Slicers in Excel
- How to Create Slicers in Excel for Dashboards
- Tips for Using Slicers Effectively
- Conclusion
- Frequently Asked Questions (FAQs)
- What is a Circular Reference in Excel?
- How to Check for Circular References in Excel
- How to Remove Circular References in Excel
- Best Practices to Avoid Circular References
- Frequently Asked Questions (FAQs)
- Conclusion
- Understanding Compound Interest
- Step-by-Step Guide to Calculating Compound Interest in Excel
- Automating Compound Interest Calculations
- Applications of Compound Interest in Excel
- Tips for Accuracy
- Frequently Asked Questions (FAQs)
- Add Prefix in Excel: Introduction
- How to Add a Prefix in Excel: Easy Methods
- How To Remove Prefix in Excel?
- Conclusion
- Frequently Asked Questions
- Why Remove Time from Date?
- Methods to Remove Time from Date in Excel
- Conclusion
- Frequently Asked Questions
- Why Delete Sheets in Excel?
- How to Delete a Sheet in Excel Shortcut
- How to Delete Multiple Sheets in Excel
- How to Delete a Worksheet in Excel (Other Methods)
- Tips for Managing Sheets in Excel
- Conclusion
- Frequently Asked Questions
- Introduction to Barcodes in Excel
- Steps to Create a Barcode in Excel
- Advanced Techniques
- Conclusion
- Frequently Asked Questions
- Introduction to Tabs in Excel
- Methods to Insert a Tab in Excel
- Renaming and Managing Tabs
- Best Practices for Using Tabs in Excel
- Conclusion
- Frequently Asked Questions
- What is the SUBTOTAL Function?
- Why Use the SUBTOTAL Function?
- SUBTOTAL Function Syntax
- Function Numbers Overview
How to Use the SUBTOTAL Function
- Subtotal Feature: Filtering Data with Ease
- Aggregate Functions in Excel
- Summary Functions in Excel
- Common Mistakes to Avoid
- Practical Examples of Using SUBTOTAL
- Conclusion
- Method 1: Delete a Single Row
- Method 2: Delete Multiple Rows at Once
- Method 3: Delete Rows Based on a Condition (Using Filters)
- Method 4: Delete Blank Rows
- Method 5: Delete Rows with Keyboard Shortcuts
- Method 6: Delete Rows in Excel Online or Mac
- Method 7: Undoing a Row Deletion
- Troubleshooting Common Issues
- Frequently Asked Questions
- Why Should You Use Wrap Text in Excel?
- How to Wrap Text in Excel: Steps-by-Step Process
- Alternative Method: Use Format Cells
- Additional Tips for Using Wrap Text
- Conclusion
- Frequently Asked Questions
- What is a Macro in Excel?
- How to Add Macros in Excel?
- Running and Managing Macros
- Troubleshooting and Saving Macros
- Additional Resources for Mastering Macros
- Conclusion
- Frequently Asked Questions
- What is XLOOKUP?
- Practical XLOOKUP Examples in Excel
- Implementation Tips for XLOOKUP In Excel
- Closing Thoughts
- Frequently Asked Questions
- Creating and Customizing Charts in Excel
- Overview of Different Types of Charts in Excel
- Final Remarks
- Frequently Asked Questions
- Introduction to the ROUND Function
- How to Use the ROUND Function
- Additional Functions Related to ROUND
- Benefits & Common Use Casesof Using ROUND Function in Excel
- Frequently Asked Questions
- 1. Using the Symbol Menu
- 2. Using a Keyboard Shortcut (Windows)
- 3. Copy-Paste Method
- 4. Using the UNICHAR Function
- 5. Changing the Currency Format
- 6. Using Excel Add-Ins
- Conclusion
- Frequently Asked Questions
- Basics of INDEX MATCHFormula in Excel
- How INDEX and MATCH Work Together
- Practical Examples of INDEX MATCH Formula in Excel
- Using Absolute and Mixed References in INDEX MATCH
- Common Errors and How to Fix Them
- Advanced Techniques with INDEX MATCH
- Frequently Asked Questions
- Cell Addresses in Excel
- Exploring the ADDRESS Function
- Types of Cell References
- Advanced Reference Techniques
- Frequently Asked Questions
- How to Change Date Format in Excel?
- Why Correct Date Formats Matter?
- Common Date Format Challenges
- How to Change Date Format In Excel: Troubleshooting Common Issues
- Frequently Asked Questions
- Create Bar Charts in Excel
- Customize Bar Appearance in Excel
- Explore Layout and Styles
- Frequently Asked Questions
- Understanding the EMI Formula in MS Excel
- Step-by-Step Guide to Calculate EMI in Excel
- Using Excel for Different EMI Calculations
- Additional Tips for Efficient Loan EMI Calculation
- Conclusion
- Frequently Asked Questions
- Spell Check in Excel: Why is it important?
- How to Spell Check in Excel?
- Automatic Spell Correction in Excel
- Troubleshoot Common Spell Check Issues
- Customizing Spell Check in Excel
- Final Remarks
- Frequently Asked Questions
- Why Use the TRIM Function in Excel?
- Understanding the TRIM Formula in Excel
- Practical Examples of TRIM in Excel
- Common Issues and Solutions
- Best Practices for Using TRIM
- Final Words
- Frequently Asked Questions
How To Create A Dashboard In Excel: Step-by-Step Guide
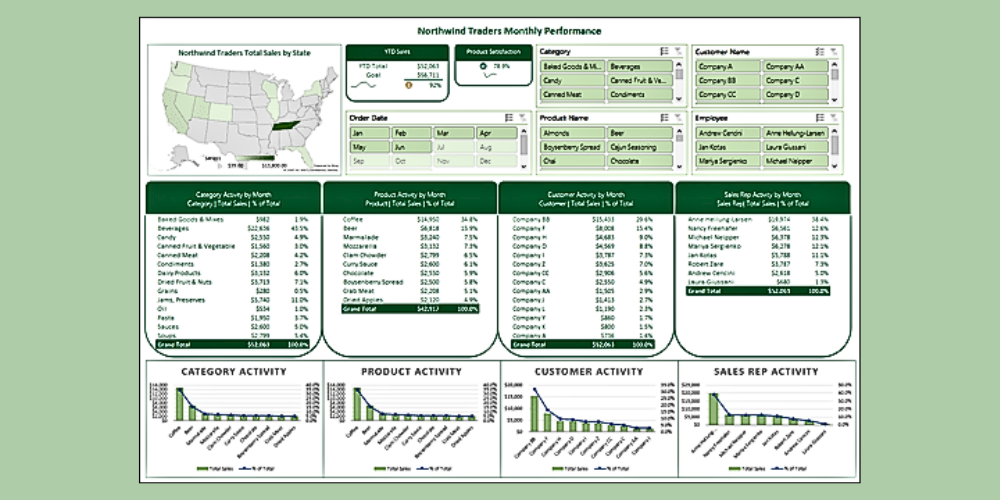
An Excel dashboard is a collection of charts, tables, and indicators that present data in a clear, easily digestible format.
Creating a dashboard in Excel might seem challenging, but it’s simpler than you think. With the right tools, you can craft a dashboard that not only looks great but also provides valuable insights. This article will walk you through the process, from understanding what a dashboard is to designing one that effectively communicates your data.
Understanding Excel Dashboards
An Excel dashboard is a collection of charts, tables, and indicators that present data in a clear, easily digestible format. Similar to the dashboard of a car, an Excel dashboard provides an overview of key data metrics, enabling quick decision-making without needing to sift through raw data. Dashboards are crucial for tracking performance, monitoring trends, and identifying insights from large datasets. They transform raw data into actionable information.
Why Use Excel Dashboards?
Many professionals rely on Excel dashboards because they simplify data analysis and reporting. Approximately 80% of data goes unanalyzed, but with a well-designed dashboard, you can uncover trends and insights that might otherwise go unnoticed. Dashboards are especially valuable for tracking business metrics, managing projects, and generating reports.
How to Make a Dashboard in Excel?
Step 1: Import Data into Excel
Start by importing your data into Excel. You can bring in data from various sources, including Access, text files, and other workbooks. Ensure your data is clean and well-organized before importing, as this will make the dashboard creation process smoother.
Step 2: Prepare Workbook Structure
Organize your workbook for clarity. Separate sheets should be used for raw data, calculations, and the dashboard itself. This will help keep the dashboard clean and manageable, especially when dealing with large datasets. Use features like freezing panes to keep headers visible when scrolling.
Step 3: Convert Data into Tables
Convert your raw data into Excel tables. Tables allow for easy sorting, filtering, and data manipulation. They also expand automatically when new data is added, which ensures that your dashboard remains up-to-date.
Step 4: Choose Suitable Visuals
Select the appropriate visualizations for your data. Use bar charts for comparisons, pie charts for proportions, and line charts for trends. Ensure that the visuals are easy to interpret and visually appealing. Consistent color schemes across your dashboard improve readability and user experience.
Also Read: Types of Charts in Excel
Step 5: Build a Pivot Table
PivotTables are invaluable for summarizing large datasets. They allow you to extract meaningful insights from complex data and present them in a more digestible format. After creating your PivotTable, you can use filters, slicers, and timelines to add interactivity to the dashboard.
Step 6: Assemble the Dashboard
After setting up your tables, charts, and PivotTables, bring everything together on a single worksheet. Arrange the elements logically so that users can easily follow the data’s narrative. Consistency in layout and design will make the dashboard more intuitive and user-friendly.
Key Features of Excel for Dashboards
Excel offers a variety of features that make it an excellent tool for building dashboards. Its cell-based structure makes organizing and analyzing data efficient. Excel also provides a rich library of charts and visualizations, such as bar graphs, line charts, and pie charts, which can be customized to fit your needs. You can also enhance your dashboard’s interactivity with filters and slicers, enabling users to drill down into specific data points.
1. Define the Dashboard’s Purpose
Before diving into design, clarify the purpose of your dashboard. What problem is it solving? Whether tracking sales, project progress, or financial performance, defining the objective is critical for building an effective dashboard. A clear purpose will guide your design decisions and help you stay focused.
2. Identify the Target Audience
Consider who will be using the dashboard. Tailor the complexity and format based on the audience’s familiarity with the data. For example, a detailed dashboard might be suitable for a team of analysts, but a high-level summary could be better for senior management. Understanding your audience ensures the dashboard meets their needs.
3. Select Relevant Data Sets
Choose data that is relevant to the dashboard’s purpose. For a financial dashboard, you might include metrics like revenue, expenses, and forecasts. For a project management dashboard, focus on deadlines, resource allocation, and progress tracking. Each piece of data should contribute to the overall story the dashboard tells.
Common Challenges with Excel Dashboards
1. Manual Data Entry Issues
One of the biggest challenges in creating an Excel dashboard is manual data entry. Typing in large datasets by hand is time-consuming and error-prone. To minimize errors, use data import tools to automate the process, especially when pulling data from databases or other systems.
2. Risks of Human Error
Human error is always a risk when working with Excel dashboards, particularly when using complex formulas and multiple data sets. A small mistake, such as a misplaced formula, can distort the entire dashboard. Regularly double-check formulas, links, and data sources to reduce the likelihood of errors.
3. Collaboration and Integration Constraints
Collaboration on Excel dashboards can be difficult if team members are using different versions of Excel. Inconsistent formatting and functionality across versions may cause discrepancies in how the dashboard is displayed. To mitigate this, ensure that all users have access to the same version of Excel or use cloud-based solutions for real-time collaboration.
Designing Effective Dashboards: Tips
The design of your dashboard is just as important as its content. A well-designed dashboard communicates data quickly and clearly. Follow these best practices to ensure your dashboard is effective:
- Keep it Simple: Avoid clutter. The most important information should be easily accessible and digestible. Use a clean, organized layout and concise labels.
- Use Consistent Color Schemes: Select colors that are easy on the eyes and ensure they are colorblind-friendly. Stick with a consistent color palette to avoid confusion.
- Prioritize Readability: Choose legible fonts, ensure there’s enough contrast between text and background, and make use of freeze panes to keep headings visible when scrolling through large data sets.
- Tell a Story: A dashboard should guide users through the data. Ensure the layout flows logically and presents the most critical information first.
Conclusion
Creating an Excel dashboard involves several steps, from defining the purpose and gathering the relevant data to designing and assembling the dashboard itself. With careful planning, clear design principles, and attention to detail, you can build an interactive and effective dashboard that helps users make informed decisions.
While challenges such as manual data entry and human error can arise, these can be mitigated with the right preparation and tools. Ultimately, an Excel dashboard is a powerful tool that brings clarity to your data, transforming complex information into actionable insights.
Quiz Time!!!
Frequently Asked Questions
Q1. What is an Excel dashboard?
An Excel dashboard is a visual tool. It shows you important metrics and data in one place. Dashboards facilitate tracking performance and making data-driven decisions.
Q2. Why should I plan my Excel dashboard?
Planning makes it clear and efficient. It sets you up to know what metrics and data sources matter before design. Good planning saves time and eliminates mistakes.
Q3. What are the basic steps to create a dashboard in Excel?
You start with the writing by getting data. Use Excel tools such as PivotTables and charts. Craft your layout. Add interactivity with slicers or filters. Make it easy and specific.
Q4. How can I design effective Excel dashboards?
Be interested in clarity and simplicity. I’ll finish up with colors — don’t use them frivolously. Remember to highlight key metrics. Organize layout for easy navigation. Always write for your audience.
Q5. What are common challenges with Excel dashboards?
Errors in data, complicated designs, and performance issues. Avoid these by planning, testing, and using Excel’s built-in tools accurately.
Q6. Are there useful Excel dashboard templates available?
Yes, there are a lot of free and premium templates out there. They can save time, provide inspiration, and ensure professional design. You can customize them to fit your needs.
Suggested Reads:
Login to continue reading
And access exclusive content, personalized recommendations, and career-boosting opportunities.
Don't have an account? Sign up
Never miss an
Update

Featured Opportunities
Top-Rated Practice by Students


Subscribe
to our newsletter


Comments
Add comment