
Asian Paints Alchemy 2026
Finance
- What Is Walter's Model Of Dividend?
- Key Concepts Of Walter's Model
- Dividend Policies
- Walter's Model Formula And Assumptions
- Model Limitations
- Conclusion
- Frequently Asked Questions
- Exploring Cash And Fund Flow
- Importance Of Cash & Fund Flow Statement
- Components Of Cash & Fund Flow Statement
- Exploring The Key Differences With Examples
- Significance And Application
- Advantages And Disadvantages
- Conclusion
- Frequently Asked Questions
- Definition Of Comparative Statement
- Types Of Comparative Statements
- Formulas For Comparative Statement
- Example Of Comparative Income Statement
- Preparing Comparative Statement
- Steps For Income & Balance Sheets
- Understanding Cash Flow Comparisons
- Practical Examples Explained
- Limitations And Considerations
- Conclusion
- Frequently Asked Questions (FAQs)
- Definition Of Dividend Decision
- Key Factors Influencing Dividend Decision
- Objectives Of Dividend Decision
- Theories And Determinants
- Policies Of Dividend Decision
- Conclusion
- Frequently Asked Questions (FAQs)
- Role of Fund Flow Statement Analysis
- Key Objectives of Preparing a Fund Flow Statement
- Importance of a Fund Flow Statement
- How to Prepare a Fund Flow Statement: A Step-by-Step Guide
- Fund Flow Statement vs. Cash Flow Statement
- How Fund Flow Analysis Empowers Investors and Management
- Limitations of a Fund Flow Statement
- Conclusion
- Frequently Asked Questions (FAQs)
- Definition Of Financing Decision
- Types Of Financial Decisions
- Examples Of Financing Decisions
- Key Factors In Financial Decision-Making
- Theories Of Financial Decision
- Analyzing Costs And Risks
- Evaluating Market & Regulatory Impacts
- Conclusion
- Frequently Asked Questions (FAQs)
- Definition Of Finance Function
- Core Components Of Finance Function
- Functions Of Financial Management
- Importance Of Finance Decision
- Scope Of Finance Function
- Objectives Of Financial Management
- Integrating Decisions Into Business Strategy
- Conclusion
- Frequently Asked Questions (FAQs)
- Definition Of Profit & Wealth Maximization
- Top 5 Key Differences Highlighted
- Calculation Method (Formula)
- Which Approach Is More Sustainable
- How It Impacts Different Stakeholders
- Role Of Decision-Making In Maximization
- Conclusion
- Frequently Asked Questions (FAQs)
- Definition Of Capital Structure
- Top 10 Factors Affecting Capital Structure
- Conclusion
- Frequently Asked Questions (FAQs)
- Defining Working Capital Cycle
- Importance Of Working Capital Cycle
- Components Of Working Capital Cycle
- Steps Of Working Capital Cycle
- Formula Used For Calculation
- Positive vs Negative Working Capital
- Reducing The Cycle
- Conclusion
- Frequently Asked Questions
- What is a Common Size Statement?
- Common Size Statement Format & Formula
- Common Size Statement Analysis
- Importance of Common Size Statement
- Difference Between Common Size and Comparative Statement
- Conclusion
- Frequently Asked Questions (FAQs)
- Definition Of Gordon Growth Model
- Formula & Example Of GGM
- Applications In Investment Valuation
- Gordon Growth Vs. Dividend Discount Model (DDM)
- Pros And Cons Of The Model
- Conclusion
- Frequently Asked Questions (FAQs)
- Definition & Concept Of Maximization
- Importance & Benefits Of Wealth Maximization
- Approaches & Challenges
- Wealth Maximization Vs. Profit Maximization
- Strategies To Implement Wealth Maximization
- Relation Of Psychological Aspects & Wealth
- Conclusion
- Frequently Asked Questions (FAQs)
- What Is Investment Decision? (Meaning)
- Key Factors Influencing Investment Decisions
- Importance of Investment Decision
- Exploring Capital Budgeting Methods
- Net Present Value Vs Internal Rate Of Return
- Addressing Inflation Effects
- Conclusion
- Frequently Asked Questions (FAQs)
- What Is Discounted Payback Period?
- Understanding The Basic Concept
- Formula & Calculation With Example
- Advantages, Disadvantages And Application
- Payback Vs. Discounted Payback
- Role & Influence Of Decision Rule Explained
- Conclusion
- Frequently Asked Questions (FAQs)
- What Is Working Capital Management
- Key Components Of Working Capital
- Importance Of Working Capital Management
- Working Capital Cycle & Formula
- Key Ratios In Working Capital Management
- Factors Influencing Working Capital
- Strategies For Working Capital Management
- Conclusion
- Frequently Asked Questions (FAQs)
- Meaning Of Financial Sources In Business
- Primary And Secondary Sources Of Finance
- Top 7 Sources Of Finance For Business
- Traditional Vs Modern Sources Of Finance
- Classification Of Finance Sources Based On Time Period
- Classification & Impact Based On Ownership
- Strategies For Choosing The Right Sources Of Finance
- Conclusion
- Frequently Asked Questions (FAQs)
- What Is Profitability Index?
- Key Features Of PI As A Financial Tool
- Profitability Index Formula
- How To Calculate Profitability Index
- Advantages & Disadvantages Of PI
- Conclusion
- Frequently Asked Questions (FAQs)
- What Is Annual Recurring Revenue?
- Importance Of ARR For Business Growth
- Formula And Steps To Calculate ARR
- Differences Between ARR and MRR
- Conclusion
- Frequently Asked Questions
- What Is Capital Budgeting?
- Types & Features Of Capital Budgeting
- Importance Of Capital Budgeting
- Methods Used In Capital Budgeting
- Capital Budgeting Process
- Capital Budgeting Vs. Operational Budgeting
- Conclusion
- Frequently Asked Questions (FAQs)
- What Is Financial Statement Analysis?
- Importance & Benefits
- Types Of Financial Statement Analysis
- Methods Of Financial Statement Analysis
- Steps In Financial Statement Analysis
- Conclusion
- Frequently Asked Questions (FAQs)
- What Is The Cost Of Capital?
- Key Components Of Cost Of Capital
- WACC & Formula
- Factors Influencing Cost Of Capital
- Role Of Cost Of Capital In Financial Decisions
- Role In Investment Decisions & Mergers
- Impact On Business Operations & Strategies
- Conclusion
- Frequently Asked Questions
- What Is Internal Rate Of Return (IRR) In Finance?
- Key Concepts Of IRR
- Formula To Calculate Internal Rate Of Return
- Applications Of IRR In Finance
- Limitations & Challenges Of IRR
- Conclusion
- Frequently Asked Questions (FAQs)
- What Is Cost of Equity?
- Key Factors Affecting Cost Of Capital
- Role Of Cost Of Equity In Finance
- Methods to Calculate Cost of Equity
- Formula Of Cost Of Equity
- Components Of Cost Of Equity
- Cost Of Equity Vs. Related Financial Concepts
- Conclusion
- Frequently Asked Questions (FAQs)
- What Is Ratio Analysis?
- Importance Of Ratio Analysis
- Types Of Financial Ratios Analysis
- Methods Used To Conduct Ratio Analysis
- Applications And Examples
- Conclusion
- Frequently Asked Questions (FAQs)
- What Is Net Present Value (NPV)?
- Why Use NPV? Top 5 Benefits
- NPV Formula Explained
- Steps To Calculate NPV With Example
- Positive Vs. Negative NPV
- Advantages And Disadvantages Of NPV
- NPV Vs. Other Financial Metrics
- Conclusion
- Frequently Asked Questions
- What Is The Time Value Of Money?
- Time Value Of Money Formula
- Importance Of Time Value Of Money
- Methods & Techniques Of Time Value of Money
- Relationship Between Opportunity Cost And Time Value
- Inflation's Impact on Time Value
- Conclusion
- Frequently Asked Questions (FAQs)
- What Is Financial Management?
- Types of Financial Management
- Importance of Financial Management
- Key Functions Of Financial Management
- Best Practices For Financial Management
- Conclusion
- Frequently Asked Questions
- What Is Leverage In Financial Management?
- Types Of Leverage In Financial Management
- Financial Leverage Formula
- Risks & Benefits Of Financial Leverage
- Conclusion
- Frequently Asked Questions
- What Is A Dividend?
- Types Of Dividends
- Dividend In Financial Management
- Examples Of Dividend
- Impacts Of Dividends On Share Prices
- Reasons Companies Pay or Not Pay Dividends
- Conclusion
- Frequently Asked Questions
Common Size Statement: A Tool for Financial Analysis & Performance
A Common Size Statement shows each financial item as a percentage of a base, helping compare performance over time or across firms. Read on for more information.
In the vast sea of financial data, making sense of raw numbers can be overwhelming. Companies generate numerous financial reports, but how do you truly compare performance over different periods, or benchmark against competitors of varying sizes? This is where the Common Size Statement emerges as an indispensable analytical tool, transforming absolute figures into powerful, comparable percentages.
What is a Common Size Statement?
A Common Size Statement is a financial statement (either an Income Statement or a Balance Sheet) where each line item is expressed as a percentage of a base figure within the same statement. This conversion standardizes the financial data, eliminating the distortion caused by differences in company size or changes in activity levels over time.
For an Income Statement (or Profit & Loss Statement), the base figure is typically Net Sales Revenue. Every revenue and expense item is then shown as a percentage of this net sales figure.
For a Balance Sheet, the base figure is usually Total Assets (which is always equal to Total Liabilities + Shareholders' Equity). Every asset, liability, and equity item is expressed as a percentage of this total.
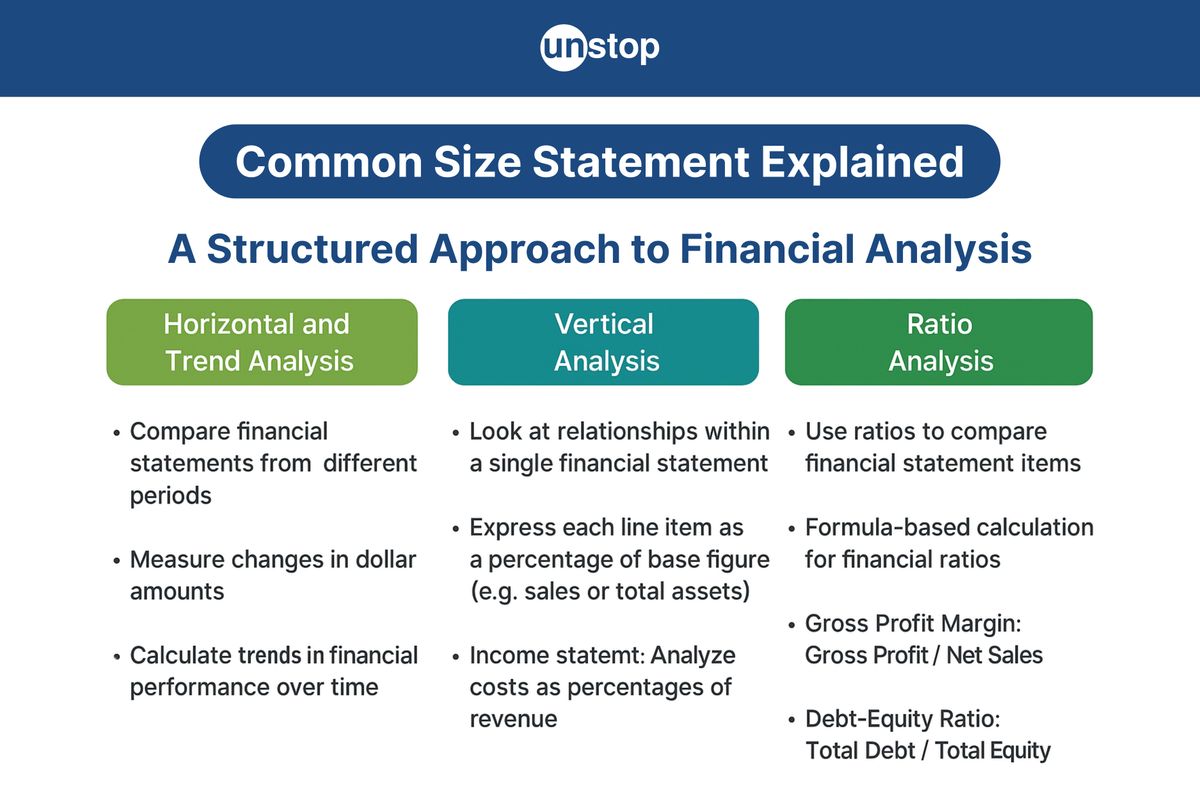
This standardization allows for a 'vertical analysis,' making it easy to see the proportional composition of a company's financial structure and operational performance.
Objectives of Common Size Statement
The preparation and analysis of a Common Size Statement serve several crucial objectives for financial analysts, management, investors, and creditors:
|
Purpose |
Explanation |
|
Intra-firm Comparison |
Enables comparison of a company's financial performance across different accounting periods. Reveals trends and shifts in assets, liabilities, and expenses. |
|
Inter-firm Comparison |
Converts financials into percentages, allowing comparison between companies of different sizes within the same industry. Example: comparing the Cost of Goods Sold to Sales between a startup and a multinational. |
|
Identifying Financial Trends |
Helps detect major changes in financial structure or efficiency over time. For example, spotting if administrative expenses are rising faster than sales. |
|
Assessing Operational Efficiency |
Evaluates how well a company controls its costs relative to revenue. A rising percentage of selling expenses to sales may indicate inefficiency. |
|
Understanding Financial Structure |
The Balance Sheet view shows how assets are financed (debt vs. equity) and how resources are allocated. |
Common Size Statement Format & Formula
Preparing a Common Size statement involves a simple but powerful calculation. Each item is divided by the base figure and multiplied by 100 to get a percentage.
Common Size Income Statement Format & Formula
For a Common Size Income Statement, Net Sales Revenue is always taken as 100%.
Formula for each Income Statement item: Percentage of Item=(Absolute Value of Item/Net Sales Revenue)×100
|
Particulars |
Absolute Amount (INR) |
% of Net Sales Revenue |
|
Net Sales Revenue |
10,00,000 |
100.00% |
|
Less: Cost of Goods Sold |
6,00,000 |
60.00% |
|
Gross Profit |
4,00,000 |
40.00% |
|
Less: Operating Expenses: |
||
|
Selling Expenses |
1,00,000 |
10.00% |
|
Administrative Expenses |
50,000 |
5.00% |
|
Total Operating Expenses |
1,50,000 |
15.00% |
|
Operating Profit |
2,50,000 |
25.00% |
|
Add: Non-Operating Income |
10,000 |
1.00% |
|
Less: Interest Expense |
20,000 |
2.00% |
|
Net Profit Before Tax |
2,40,000 |
24.00% |
|
Less: Income Tax (30%) |
72,000 |
7.20% |
|
Net Profit After Tax |
1,68,000 |
16.80% |
Common Size Balance Sheet Format & Formula
For a Common Size Balance Sheet, Total Assets (or Total Liabilities & Equity) is always taken as 100%.
Formula for each Balance Sheet item: Percentage of Item=(Absolute Value of Item/Total Assets)×100
|
Particulars |
Absolute Amount (INR) |
% of Total Assets / Liabilities & Equity |
|
ASSETS: |
||
|
Non-Current Assets: |
||
|
Property, Plant & Equipment |
8,00,000 |
40.00% |
|
Investments |
2,00,000 |
10.00% |
|
Current Assets: |
||
|
Inventory |
5,00,000 |
25.00% |
|
Accounts Receivable |
3,00,000 |
15.00% |
|
Cash & Bank Balances |
2,00,000 |
10.00% |
|
Total Assets |
20,00,000 |
100.00% |
|
LIABILITIES & EQUITY: |
||
|
Equity: |
||
|
Share Capital |
10,00,000 |
50.00% |
|
Retained Earnings |
2,00,000 |
10.00% |
|
Non-Current Liabilities: |
||
|
Long-term Debt |
5,00,000 |
25.00% |
|
Current Liabilities: |
||
|
Accounts Payable |
2,00,000 |
10.00% |
|
Short-term Loans |
1,00,000 |
5.00% |
|
Total Liabilities & Equity |
20,00,000 |
100.00% |
Common Size Statement Analysis
Common Size Statement analysis involves more than just calculating percentages; it's about interpreting what those percentages reveal:
Income Statement Analysis:
- Cost Structure: Track changes in the percentage of COGS, selling, and administrative expenses relative to sales. A rising COGS percentage might indicate rising production costs or less efficient purchasing.
- Profitability Trends: Observe the trends in Gross Profit, Operating Profit, and Net Profit percentages. Are profit margins improving or deteriorating?
- Efficiency: Compare the percentage of operating expenses (selling, administrative) to sales. Lower percentages often indicate better cost control.
Balance Sheet Analysis:
- Asset Composition: Analyze how the company's assets are distributed. Is a larger proportion tied up in fixed assets or current assets? Has cash increased or decreased proportionally?
- Capital Structure: Examine the mix of debt (long-term and short-term liabilities) versus equity used to finance assets. A rising percentage of long-term debt might indicate increased leverage.
- Liquidity & Solvency: While not direct measures, changes in the proportion of current assets to total assets (liquidity) or debt to equity (solvency) can signal shifts.
By comparing these percentages over several periods for the same company (time-series analysis) or against industry averages and competitors (cross-sectional analysis), analysts can uncover underlying strengths, weaknesses, and significant trends that absolute numbers might obscure.
Importance of Common Size Statement
The importance of the Common Size Statement stems from its ability to standardize financial information, offering a clearer, more insightful view:
- Eliminates Size Bias: It neutralizes the impact of differing company sizes, allowing for true "apples-to-apples" comparisons.
- Highlights Proportional Changes: It makes changes in the composition of revenues, expenses, assets, or liabilities strikingly clear, even if the absolute values have increased.
- Aids in Trend Analysis: It is highly effective for spotting trends in cost control, profitability, and financial structure over time.
- Facilitates Benchmarking: Companies can easily benchmark their performance against industry leaders or competitors, identifying areas where they are more or less efficient.
- Supports Strategic Decision-Making: Insights derived from common size analysis can inform management decisions related to cost reduction, investment strategies, financing choices, and operational improvements.
Difference Between Common Size and Comparative Statement
While both Common Size Statements and Comparative Statements are tools for financial analysis, they serve distinct purposes and present information differently:
|
Feature |
Common Size Statement |
Comparative Statement |
|
Primary Goal |
Shows each item as a percentage of a base figure within the same statement (e.g., Sales for P&L, Total Assets for Balance Sheet). Focuses on proportional composition. |
Shows absolute financial figures for two or more periods side-by-side, along with their absolute and percentage change. Focuses on growth/decline. |
|
Output Type |
Percentages |
Absolute figures and percentage change |
|
Analysis Type |
Vertical Analysis (within one period/statement) |
Horizontal Analysis (across multiple periods for changes) |
|
Key Insight |
Reveals the internal structure and relative importance of items. Facilitates inter-firm comparisons by neutralizing size. |
Reveals the magnitude and direction of change over time. Useful for understanding growth or contraction trends within a single entity. |
|
Example |
"Cost of Goods Sold is 60% of Sales" |
"Sales increased by INR 1,00,000 or 10% from last year" |
|
Use Case |
Benchmarking against competitors, understanding expense structure, and analyzing asset mix. |
Tracking sales growth, expense escalation, or asset accumulation over time. |
In essence, a Common Size Statement answers the question, "What proportion of this is that?" while a Comparative Statement answers, "How much did this change from then to now?" Both are valuable and often used together for a holistic financial review.
Conclusion
The Common Size Statement is a foundational and incredibly powerful tool in financial analysis. Converting absolute financial figures into relative percentages provides unparalleled clarity, enabling meaningful comparisons across different periods or between disparate entities. Its ability to strip away the noise of scale differences allows for sharp insights into a company's operational efficiency, financial structure, and underlying trends.
For anyone seeking to truly understand the dynamics of a business beyond just its raw numbers, mastering the preparation and analysis of Common Size Statements is an essential step towards robust financial acumen.
Time For A Short Quiz
Frequently Asked Questions (FAQs)
1. What are Common Size Statements?
Common Size Statements are financial reports that express each item as a percentage of a key figure, usually total revenue or total assets. This approach simplifies the comparison of financial information between various companies or over different time periods.
2. Why are Common Size Statements important?
Common Size Statements are valuable tools for evaluating and comparing the financial health of companies across various sizes and sectors. They reveal the relative percentages of different financial elements, helping to spot trends and support informed decision-making in business.
3. How can Common Size Statements be prepared?
To prepare Common Size Statements, each line item on the financial statement is divided by a base figure (such as total revenue or total assets) and multiplied by 100 to express it as a percentage. This process standardizes the data for better analysis and comparison.
4. In what real-world scenarios are Common Size Statements useful?
Common Size Statements are essential tools used by investors, analysts, and managers to evaluate a company’s financial health, assess operational efficiency, and benchmark performance against industry peers. They play a vital role in financial analysis, budgeting, and strategic planning.
5. What are the limitations of Common Size Statements?
While useful, Common Size Statements may oversimplify complex financial information and overlook qualitative factors affecting performance. They rely heavily on accurate data input and may not capture nuances unique to specific industries or business models. Careful interpretation is essential for meaningful analysis.
Suggested reads:
Login to continue reading
And access exclusive content, personalized recommendations, and career-boosting opportunities.
Don't have an account? Sign up
Never miss an
Update

Featured Opportunities
Top-Rated Practice by Students


Subscribe
to our newsletter


Comments
Add comment