
Asian Paints Alchemy 2026
Aptitude
- Step 1: The Groundwork
- Step 2: The Three Sections
- Step 3: Practice Makes Improvement
- The Secret Ingredient
- Understanding Basics Of Number Series
- Types Of Number Series Reasoning Questions
- Addition & Multiplication In Number Series
- Square & Cube-Based Number Series Patterns
- Missing Terms & Arranging Sequences
- Tricks & Tips For Solving Number Series
- Selected Number Series Questions With Solutions
- Frequently Asked Questions (FAQs)
- Must Know Terminologies in Blood Relation Questions
- Basic Approaches to Solve Blood Relation Questions
- Types Of Blood Relation Questions
- Tips For Solving Blood Relation Questions
- Multiple Choice Questions (MCQs) with Detailed Explanation
- Conclusion
- Frequently Asked Questions (FAQs)
- Letter Series In Logical Reasoning
- Types Of Letter Series Patterns
- Tips For Solving Letter Series Reasoning
- Best Practice Question Samples With Answers
- Conclusion
- Frequently Asked Questions (FAQs)
- Basics of Problems On Age-Related Questions
- Formula to Solve Problems on Ages-Related Questions
- Types of Age-Related Questions & Examples
- Tips & Tricks for Solving Ages Problems
- Best MCQs on Problems on ages with solved answers
- Conclusion
- Frequently Asked Questions (FAQs)
- Definition of Calendar
- Understanding Days of the Week
- What is a Leap Year?
- Concept of Odd Days in a Century
- Tips For Solving Calendar Reasoning Questions
- Best Calendar Reasoning Questions with Answers (MCQs)
- Frequently Asked Questions (FAQs)
- Basic Concepts of Clock
- Structure of a Clock
- Angle Equilavalence in Clock
- Tips For Solving Clock Questions
- Selected Clock Questions & Answers (MCQs)
- Conclusion
- Frequently Asked Questions (FAQs)
- Understanding The Concept Of Direction Sense
- Tips For Effective Problem-Solving In Direction Sense
- Practical Test Practice Questions And Answers
- Conclusion
- Frequently Asked Questions (FAQs)
- Importance Of Dice Reasoning
- Dice Numbers In Dice Reasoning
- Classification Of Dice
- Constructed Vs Deconstructed Dice
- Tricks & Tips For Solving Dice Problems
- Practice MCQs With Detailed Answers
- Conclusion
- Frequently Asked Questions (FAQs)
- Alphanumeric Series Defined
- Alphanumeric Series In Reasoning Tests
- Tips & Strategies For Solving Alphanumeric Series
- Practice Sample Questions With Detailed Answers
- Conclusion
- Frequently Asked Questions (FAQs)
- Concept Of Mirror Image Reasoning Explained
- Important Terms In Mirror Image Reasoning
- Types Of Mirror Images
- Identifying Correct Mirror Image
- Finding Clock's Mirror Image
- Tips To Solve Mirror Images
- Selected Practice Questions With Answers
- Conclusion
- Frequently Asked Questions (FAQs)
- Concept & Overview Of Input-Output
- Input-Output In Competitive Exams
- Types Of Input-Output Problems
- Strategies, Tips & Tricks For Solving Reasoning Questions
- Selected Practice Questions With Answers
- Conclusion
- Frequently Asked Questions (FAQs)
- Importance Of Finding The Odd One Out
- Tricks And Tips
- How to Find The Odd One Out?
- Solved MCQs with Detailed Explanation
- Conclusion
- Frequently Asked Questions (FAQs)
- Understanding Key Concepts
- Exploring Different Ranking Types
- Formula And Application Of Order And Ranking
- Tips For Solving Order & Ranking
- Selected Practice Questions And Answers
- Conclusion
- Frequently Asked Questions (FAQs)
- Importance Of Pipes & Cistern Aptitude
- Key Terminologies used in Pipes and Cisterns
- Pipes and Cisterns Formula with Examples
- Pipes and Cisterns Shortcut Tricks
- Tips For Solving Pipes & Cistern Problems
- Selected Questions & Answers For Practice (MCQs)
- Conclusion
- Frequently Asked Questions (FAQs)
- Key Concept in Boats and Streams
- Formulas Of Boats & Streams
- Distance & Time Formula
- Tips For Solving Boats & Streams Questions
- Selected Practice Questions With Answers (MCQs)
- Conclusion
- Frequently Asked Questions (FAQs)
- Concept of Mixture and Alligation
- Types Of Alligation Questions
- Formula for Solving Mixture & Alligation
- Tips For Solving Mixture And Alligation
- Selected Questions With Answers For Practice
- Conclusion
- Frequently Asked Questions (FAQs)
- Concepts and Definitions Related to Time and Work
- Important Time And Work Formulas
- Tricks and Tips to Solve Time & Work Questions
- Time And Work MCQs with Detailed Solution
- Conclusion
- Frequently Asked Questions (FAQs)
- What is Harmonic Progression(HP)?
- Formula to find the nth Term in Harmonic Progression
- Formula to find the Sum of the nth Term in HP
- What is Harmonic Mean?
- Harmonic Progression Solved Best MCQs
- Conclusion
- Frequently Asked Questions (FAQs)
- What is Mensuration in Maths?
- What are 2D figures in Mensuration?
- What are 3D figures in Mensuartion?
- Basic Terminologies In Mensuration
- Basic 2D Formulas in Mensuration
- Basic 3D Formulas in Mensuration
- 2D vs 3D in Mensuration
- Solved Questions With Solutions (MCQs)
- Conclusion
- Frequently Asked Questions (FAQs)
- Relationship Between Time, Speed And Distance
- Conversion Units Time, Speed And Distance
- Average & Relative Speed: Two Trains Moving in the same or opposite direction
- Solved MCQs on Time, Speed And Distance
- Conclusion
- Frequently Asked Questions (FAQs)
- What is Simplification in Maths?
- BODMAS Rule in Simplification Explained
- Simplification & Approximation Relation
- Key Terms in Simplification
- Examples Of Simplification Techniques
- Simplification Questions With Solved Answers (MCQs)
- Conclusion
- Frequently Asked Questions (FAQs)
- Height And Distance Important Terms
- Right Angled Triangle In Trigonometry
- Trigonometric Ratios
- Solved Examples For Better Understanding
- Height And Distance Applications In Trigonometry
- Height And Distance Practice Questions & Answers
- Conclusion
- Frequently Asked Questions (FAQs)
- Defining Interest Types
- Simple Interest Vs. Compound Interest
- Selected Solved Questions & Answers
- Conclusion
- Frequently Asked Questions (FAQs)
- Basic Concepts Of Profit And Loss
- Determining Selling Price
- Calculating Discounts
- Formulas For Calculating Profit And Loss
- Examples Of Profit And Loss
- Profit & Loss Questions With Detailed Solution
- Conclusion
- Frequently Asked Questions (FAQs)
- Defining Angle Of Elevation
- Key Terms Used In Angle Of Elevation
- Angle of Elevation Formula with Example
- Angle of Elevation vs. Angle of Depression
- Angle of Elevation MCQs with Answers
- Conclusion
- Frequently Asked Questions (FAQs)
- Defining HCF And LCM
- Calculation Methods Of HCF And LCM
- HCF By Prime Factorization Method
- LCM By Prime Factorization Method
- Difference Between HCF And LCM
- HCF & LCM Practice Questions With Answers
- Conclusion
- Frequently Asked Questions (FAQs)
- What is fraction and decimal?
- Understanding Decimal Fraction
- Place Value in Decimal Fraction
- Mathematical Operations with Decimal Fraction
- Practice with Solved Examples
- Summary
- Frequently Asked Questions
- All About Decimals
- All About Fractions
- How to Convert a Decimal into Fraction
- Simple vs Recurring Decimals
- Converting Recurring Decimals to Fractions
- Conversion Charts
- Practice Questions (With Solutions)
- Closing Thoughts
- Frequently Asked Questions
- What is Arithmetic Mean?
- Arithmetic Mean Formula- Ungroup Data & Group Data
- Merits of Arithmetic Mean
- Demerits of Arithmetic Mean
- Alternatives to Arithmetic Mean
- What is the Weighted Arithmetic Mean?
- Arithmetic vs. Geometric Mean
- Arithmetic Mean Application in Statistical Analysis
- Arithmetic Mean Practice Questions with Explanation
- Frequently Asked Questions
- What is Geometric Progression?
- Key Properties of Geometric Progression
- General Form Of Geometric Progression
- General Term or the Nth Term of Geometric Progression
- The sum of nth Terms of GP
- Types Of Geometric Progression
- Solved Questions and Answers of GP
- Conclusion
- Frequently Asked Questions (FAQs)
- Average in Maths
- Average Formula in Maths
- Differentiating Types of Average
- How to Calculate Average of Negative Numbers?
- Practical Applications of Averages
- Average Questions For Practice
- Frequently Asked Questions
- What is Simple Interest in Maths?
- Simple Interest Formula Explained
- Simple Interest Formula for Years, Months & Days
- Simple Interest Examples & Practice Questions
- Conclusion
- Frequently Asked Questions (FAQs)
- Defining Mathematical Ratios
- Understanding Proportions Fundamentals
- Differentiating Ratios from Proportions
- Ratio and Proportion Formulas
- Properties of Ratio and Proportion
- How to Solve Ratio and Proportion Problems
- Ratio and Proportion Problems (With Solutions)
- Summary
- Frequently Asked Questions
- What is Number in Maths?
- Types of Numbers With Example
- Real vs Complex Numbers Explored
- Basic Operations on Numbers
- Practice Questions (With Solutions)
- Frequently Asked Questions
- What is Arithmetic Progression (AP) in Maths?
- Important Terminologies in Arithmetic Progression
- Basic Terms in Arithmetic Progression
- General Form Of Arithmetic Progression Series
- Types Of Arithmetic Progression
- Solved Questions With Explanation (MCQs)
- Conclusion
- Frequently Asked Questions (FAQs)
- Understanding Basic Concept
- Importance Of Train Problems In Aptitude
- Tips To Solve Train Problems
- Selected Practice Questions & Answers
- Conclusion
- Frequently Asked Questions (FAQs)
- Definition Of Mode
- Calculating Mode For Ungrouped Data
- Calculating Mode For Grouped Data
- Bimodal, Trimodal & Multimodal Distributions
- Comparing Mean, Median & Mode
- Selected Practice Questions With Answers
- Conclusion
- Frequently Asked Questions (FAQs)
- Important Concept In Races And Games
- Calculating Time, Speed & Distance
- Importance Of Races And Games Problems
- Sample Practice Questions With Answers
- Conclusion
- Frequently Asked Questions (FAQs)
- Types Of Partnership
- Formula For Partnership Questions
- Tips To Solve Partnership Aptitude Questions
- Selected Partnership Questions (Practice MCQs)
- Conclusion
- Frequently Asked Questions (FAQs)
What Is Mode- Definition, Formula, Practice Questions & Answers
Mode represents the peak occurrence among all values, making it a crucial measure in statistical analysis. Read on to learn more.
The mode is basically the value that appears most frequently in a set of data. Knowing the mode helps us get a clear picture of how the data is spread out and what values are most common.
By identifying the mode, we can see not only the central tendency of the data but also understand which values are repeated more often than others.
Definition Of Mode
Mode is the value that appears most frequently in a given data set. It represents the peak occurrence among all values, making it a crucial measure in statistical analysis.

Calculating Mode For Ungrouped Data
Process
To calculate the mode for ungrouped data, you identify the value that appears most frequently. This value represents the mode of the dataset.
For instance, in a set of numbers like 2, 4, 5, 3, 4, and 7, the mode is 4 since it occurs twice.
Applicability
In scenarios where you have a list of individual data points without any grouping or categorization, finding the mode can help determine the most common observation.
For example, in a survey collecting respondents' favourite colours without grouping them by age or gender, identifying the mode colour gives insight into the prevalent choice among all participants.
Importance
Identifying the mode in ungrouped datasets is crucial for various reasons. It provides a simple measure of central tendency that highlights the most frequent observation.
Calculating Mode For Grouped Data
In grouped data, the modal class is the class interval with the highest frequency. It represents the range with the maximum occurrences.
To find the mode in grouped data, you first identify the modal class. Next, within this modal class, determine the modal value using the formula:
Mode=𝐿+(𝑓𝑚−𝑓𝑚−1) / 2𝑓𝑚−𝑓𝑚−1−𝑓𝑚+1×𝑐
-
The modal class, which is the one with the most occurrences, has a lower boundary denoted as L
-
fm is the frequency of the modal class.
-
fm−1 is the frequency of the class preceding the modal class.
-
fm+1 is the frequency of the class succeeding the modal class.
-
c is the class width (the difference between the upper and lower boundaries of the modal class).
This formula estimates the mode for grouped data by interpolating between the modal class and its neighbouring classes, considering their frequencies and class widths.
Bimodal, Trimodal & Multimodal Distributions
Bimodal
A bimodal distribution is characterized by having two peaks or modes in the data. This means that two values occur most frequently in the dataset.
For example, a bimodal distribution could represent the distribution of heights in a population where there are peaks for both tall and short individuals.
Trimodal
In a trimodal distribution, three distinct peaks or modes are present in the dataset. This suggests that there are three values with high frequencies.
An example of a trimodal distribution could be the distribution of exam scores in a classroom where students fall into three distinct performance groups - high, medium, and low achievers.
Multimodal
A multimodal distribution goes beyond three modes and can have multiple peaks in the data. This indicates that several values occur frequently.
An illustration of a multimodal distribution could be the distribution of temperatures throughout the year in a region with distinct seasons like spring, summer, fall, and winter.
Comparing Mean, Median & Mode
Mean vs. Median
Mean represents the average value of a dataset, calculated by adding all values and dividing by the total number. Median, on the other hand, is the middle value when data is arranged in ascending order.
When data has extreme outliers, the median is more reliable as it is not influenced by these outliers. In scenarios where there are no outliers, and a balanced distribution exists, the mean provides a better representation of the central tendency.
Mode In Data Analysis
While mean and median focus on typical values, mode highlights the most frequent data point in a set. It is especially useful in categorical data analysis, where identifying the most common category is essential.
Complementary Roles
In statistical analysis, mean, median, and mode each serve unique purposes. They complement each other by providing different perspectives on central tendencies within datasets and data values.
Click here to learn more about various topics related to quantitative aptitude, including a detailed explanation of what mode is!
Selected Practice Questions With Solution
Practice not only helps sharpen your skills but also boosts your confidence in handling diverse datasets. By engaging with different levels of difficulty, you can enhance your ability to recognize patterns and find solutions effectively.

Question 1: What is the mode of the following dataset: 2, 3, 5, 5, 7, 7, 7, 9?
a) 2
b) 5
c) 7
d) 9
Correct answer: c) 7
Explanation: In the given dataset: 2, 3, 5, 5, 7, 7, 7, 9, the number 7 appears three times, which is more frequent than any other number. Therefore, the mode of this dataset is 7.
Question 2: Find the mode of the following dataset: 4, 7, 7, 8, 9, 9, 10.
a) 9
b) 7
c) 10
d) 7 & 9
Correct answer: d) 7 & 9
Explanation: The dataset is multimodal if multiple numbers appear most frequently in the dataset. Therefore, the mode of this dataset is 7 & 9.
Question 3: What is the mode of the following dataset: 3, 5, 7, 7, 9, 9, 9, 11?
a) 3
b) 5
c) 7
d) 9
Correct answer: d) 9
Explanation: In the given dataset, the number 9 appears three times, which is more frequent than any other number. Therefore, the mode of this dataset is 9.
Question 4: Determine the mode of the following dataset: 2, 4, 4, 6, 6, 6, 8, 8, 8, 8.
a) 8
b) 4
c) 6
d) 2
Correct answer: a) 8
Explanation: Here, 8 appears most frequently. Hence, it's the correct answer.
Question 5: If a dataset's mode is 10, which of these could be the dataset?
a) 5, 8, 10, 10, 12
b) 10, 10, 10, 12, 15
c) 6, 8, 10, 11, 11
d) 7, 8, 9, 10, 11
Correct answer: b) 10, 10, 10, 12, 15
Explanation: In the given options, option b) contains the dataset where 10 appears most frequently, making it the mode.
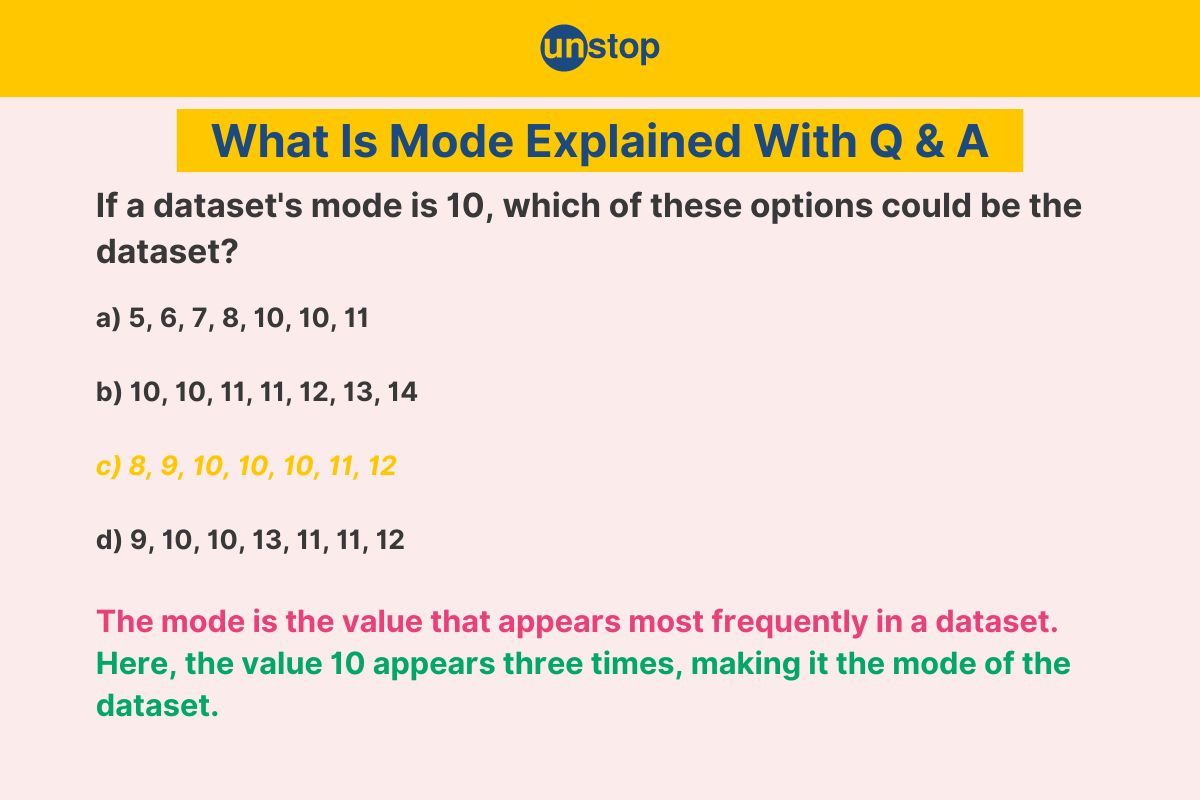
Question 6: If a dataset's mode is 10, which of these could be the dataset?
a) 5, 6, 7, 8, 10, 10, 11
b) 10, 10, 11, 11, 12, 13, 14
c) 8, 9, 10, 10, 10, 11, 12
d) 9, 10, 10, 13, 11, 11, 12
Correct answer: c) 8, 9, 10, 10, 10, 11, 12
Explanation: In a dataset, the mode is the value that appears most frequently. In option c), the value 10 appears three times, making it the mode of the dataset.
Question 7: The following table shows the frequency distribution of scores in a class:
| Score Range | Frequency |
|---|---|
| 10-20 | 5 |
| 21-30 | 8 |
| 31-40 | 12 |
| 41-50 | 15 |
| 51-60 | 10 |
What is the mode of the scores?
a) 25
b) 35
c) 45
d) 55
Correct answer: c) 45
Explanation: The mode for grouped data is estimated as the midpoint of the class interval with the highest frequency. The class interval with the highest frequency is 41-50, with a frequency of 15. Therefore, the mode is estimated to be the midpoint of this class interval, which is (41 + 50) / 2 = 45.
Question 8: The following table represents the distribution of ages (in years) of participants in a marathon:
| Age Range | Frequency |
|---|---|
| 20-29 | 15 |
| 30-39 | 25 |
| 40-49 | 20 |
| 50-59 | 30 |
| 60-69 | 10 |
What is the mode of the ages of the participants?
a) 35
b) 45
c) 55
d) 65
Correct answer: c) 55
Explanation: The mode for grouped data is estimated as the midpoint of the class interval with the highest frequency. Therefore, the mode is estimated to be the midpoint of this class interval, which is (50 + 59) / 2 = 54.5. So, the correct answer is c) 55.
Conclusion
You now have a solid grasp of what mode is, how to calculate it for different types of data, and its significance in statistics. By understanding bimodal, trimodal, and multimodal distributions, you can effectively identify patterns in your data.
Practice problems will further enhance your skills in finding the mode efficiently. Keep honing your mode calculation skills by practicing with different datasets.
Time For A Short Quiz
Frequently Asked Questions (FAQs)
1. What is the mode in statistics?
In statistics, the mode is the number that shows up the most in a set of data. It's one way to figure out the middle of the numbers, along with the mean and median.
2. How do you calculate the mode for ungrouped data?
To calculate the mode for ungrouped data, simply identify the value that occurs most frequently in the dataset. If multiple values have the same highest frequency, then the data set is considered multimodal.
3. What is the significance of identifying bimodal, trimodal, or multimodal distributions?
Identifying bimodal, trimodal, or multimodal distributions helps to understand the complexity of data patterns. It provides insights into multiple peaks or clusters within the dataset, indicating diverse trends or subgroups.
4. How does finding the mode effectively benefit statistical analysis?
Finding the mode effectively helps in understanding common patterns or predominant values within a dataset. It simplifies data interpretation by highlighting the most frequent observations, aiding decision-making processes based on popular trends.
5. Can you explain how to compare mean, median, and mode in data analysis?
In data analysis, comparing mean, median, and mode allows for a comprehensive evaluation of central tendencies. While the mean reflects the average value and the median represents the middle point, mode indicates the most recurring value, offering a holistic view of data distribution.
Suggested reads:
- Variance- Definition, Formula, Selected Practice Question & Answer
- Number System In Maths- Types, Conversion, Questions And Answers
- What Is Range- Formula & Calculation Explained (Question & Answer)
- Mean Deviation- Definition, Formula, Selected Question & Answer
- Trigonometry Table- Formula, Trick, Selected Questions & Answers
Login to continue reading
And access exclusive content, personalized recommendations, and career-boosting opportunities.
Don't have an account? Sign up
Never miss an
Update

Featured Opportunities
Top-Rated Practice by Students


Subscribe
to our newsletter


Comments
Add comment